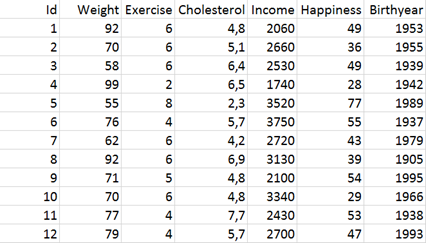
Using Python in Jupyter Notebook, construct a pandas data frame df that contains the following observations:
Add at least one markdown block to explain what you have done.
Create another data frame df2 that contains the following data of heart rates at rest:
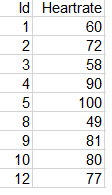
Note that individuals 6, 7, and 11 have no heart rate data.
Combine the two data frames so that there is one row per person. The new table should include the variables from both tables.
Remove those patients from the data frame who were born before year 1940.
Expand your program to compute the basic statistics (count, mean, quartiles, etc.) summary for all variables.
Compute the pairwise correlation matrix, and visualize the correlations.
Tips: Seaborn heatmap. See "Demo: Iris" material.
Pay attention to variable pairs with high positive or negative correlation. Some machine learning methods perform worse if the variables are correlated.
Create another JuPyter Notebook.
Load the Chronic kidney disease data set.
| Material | Link | Reference |
| Data set | csv | Dr.P.Soundarapandian.M.D.,D.M (Senior Consultant Nephrologist), Apollo Hospitals, Managiri, Madurai Main Road, Karaikudi, Tamilnadu, India. Downloadable via Dua, D. and Graff, C. (2019). UCI Machine Learning Repository [http://archive.ics.uci.edu/ml]. Irvine, CA: University of California, School of Information and Computer Science. |
| Explanation | txt |
Tips: See pandas documentation for read_csv, p. 222.
Your goal is to find out the minimum, maximum, and mean values and pairwise correlation coefficients of all numerical variables for the affected individuals (individuals with CKD) in the data set.
Tips: See the accompanying text document for an interpretation of the variables.
Check the data types, and check how the missing data is encoded.
Filter the data set to include only the affected patients.
For the remaining subset, print the basic statistics.
Then, calculate the pairwise correlation coefficients (correlation matrix) between each pair of numerical variables.
Back to main page